Project 1.
You decide to keep track of snowfall during a major snowstorm in Estes Park. The graph below shows the function \(s(t)\) that gives the amount of snow on the ground in inches.
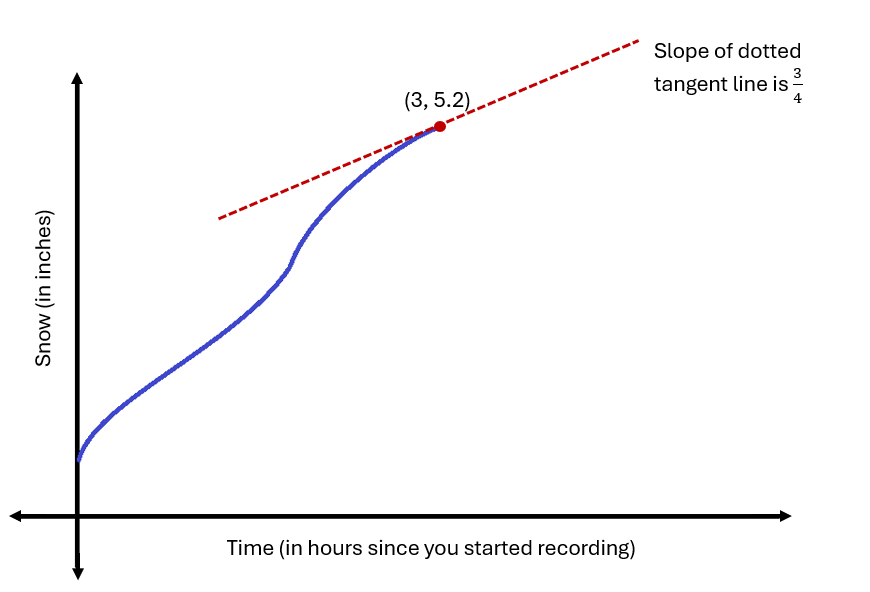
The x-axis is labeled “Time (in hours since yous tarted recording)”. The y-axis is labeled “Snow (in inches)”. The graph starts on the y-axis, slightly above the origin, then snakes upward with slight curves back and forth. The point The tangent line is drawn as a dashed line, intersecting the solid curve at the point (3, 5.2). The tangent line is labeled with its slope of 3/4. The curve ends at the tangent line.
(a)
(b)
Approximately how much snow do you expect to be on the ground 4.5 hours after you started recording?
(c)
Sketch a graph of \(s'(t)\) based on the information you have so far in the graph.
(d)
You continue tracking snowfall, but don’t check as often over time. Below is your table recording amount of snow at each hour. Using the table, Approximate \(s'(21)\text{.}\) What does this value tell you about the snow?
